
Prospect Success Indicator: Database and Calculations


Prospect Success Indicator (PSI)
PSI stands for Prospect Success Indicator. This metric will help you determine which rookies you should target in your dynasty fantasy football rookie drafts, redraft leagues, and in the NFL in general. Overall, this metric can help you find players to target or avoid for fantasy football, as well as help you find those late-round picks in your upcoming rookie drafts for dynasty leagues.
So you heard me talk about #PSI on Twitter and you’re probably wondering…
- What does PSI stand for?
- What is PSI?
- Why use PSI?
- How is it calculated?
- How do I use it for both Pre and Post NFL/Fantasy Rookie Draft?
- Finally, how does it stack up against Industry Expert Rankings of the time?
What is the Prospect Success Indicator Model?
PSI is a weighted equation of various advanced metrics designed to cut through the incoming class and narrow the field to increase our hit rates. It does this by comparing those incoming rookie profiles to that of the average Top 24 wide receiver profile. Then, it is distilled down to a percentage, the Prospect Success Indicator Percentile Rank. Finally, this tells us how close these incoming rookies match to that profile.
This Post is presented by Kumospace. Host your virtual events with Kumospace today!

FAQ: Does 90% PSI Percentile Rank mean he has a 90% chance of breaking out?
- No, it just means he’s a 90% match to the baseline profile of an average top-24 wide receiver in fantasy football. However, the higher the rank, the better the hit rates are (see tables below).
There is also a What-If PSI Percentile Rank; this score asks the question, “What if Marquise Brown wasn’t hurt during the pre-draft process, participated in all the events, and successfully completed them all?”
This percentile rank gives us a list of players who could’ve scored higher, perhaps top 50th percentile, but didn’t due to incomplete data.
Finally, the model is comprised primarily of prospects who attend the combine each and every year. In addition, their profile must have a minimum of 1 year of college experience as a full-time wide receiver.
Why Use PSI?
Using this model allows us to judge incoming rookie wide receivers based on age-adjusted production, athleticism, and draft capital. From there, we can compare them to all the other wide receivers in the database to find a good comp and to see how they stack up. With the PSI percentile score, it lets us see how closely a wide receiver is to match the top 24 wide receiver profile. For example, the higher the percentile (Ex: 90th Percentile), the better the odds this wide receiver has at achieving a top-24 season. Conversely, the lower the percentile (Ex: 5th Percentile), the less likely he is to achieve the same type of season.
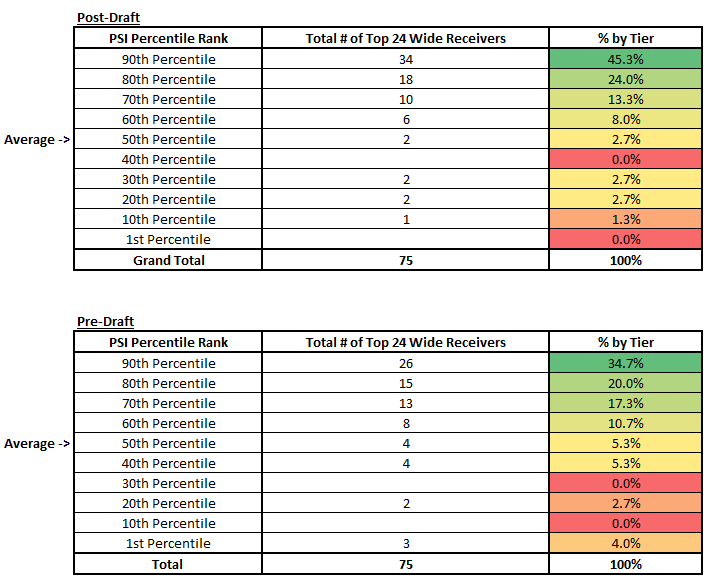
The tables below illustrate how many Top 24 seasons and wide receivers each tier has delivered with and without adjusting for draft capital. You’ll see, draft capital is important as it correlates directly with opportunity, and opportunity is king in fantasy football. Overall, that is evident in how much movement there is post-draft to the rankings.
Total number of Top 24 Seasons by tier since 2010

Total # of Top 24 Wide Receivers by Tier since 2010
How is Prospect Success Indicator Score Calculated?
- PSI w/Draft Capital
- 97% of all Top 24 wide receiver seasons came from the top 50th percentile.
- 94% came from the top 70th percentile and above.
- 93% of all Top wide receivers came from the top 50th percentile group
- 87% came from the top 70th percentile and above.
- 97% of all Top 24 wide receiver seasons came from the top 50th percentile.
- On average, PSI can cut the field of wide receivers in half each year and highlights the wide receivers that actually matter. This is a HUGE edge over your league mates, especially in the later rounds of your rookie drafts.
- This model DOES NOT account landing spot, which is determined on/after draft night (UDFA)
Below are all the advanced metrics used to calculate PSI. If you want to learn more about certain metrics, I have linked some back to their original source material.
- Breakout Age (BA) – is defined by their age at the midpoint of the college football season when they first posted a Dominator Rating at or above 20% – This was pioneered by Frank DuPont and Shawn Siegele first examined each wide receiver’s breakout age on RotoViz.com. A Breakout Age under 20 is exceptional.
- Successful Wide Receiver Measurements (SWRM) – Now that we have 10 years’ worth of combine/pro day data, I was able to re-calibrate what success means for each of the combine events.
- Pounds per inch, Hand size, Height, 40-yard dash, vertical leap, Broad jump, 20-yard shuttle, 3-cone drill
- Top 24 wide receivers hit on a least 7 of these metrics on average
- Bench Press (BP) – According to the HSCA, the bench press was the only statistically relevant drill – and even then, it’s not very high – that could predict future success. Wide receivers must be able to run block and push-off DB’s (without getting flagged), right? The baseline here is 10 or more reps for wide receivers.
- Alpha Wide Receiver (AWR) – This is new for the 2020 model. It’s a basic metric pass/fail metric that gets at the hypothesis that in order to be a top receiver in the NFL, you need to have been one in college. What I found was that of the (54) prospects to go on to have a top 24 season in the NFL, (51) of them were the #1 receiver (yards) on their own college team for at least 1 year.
- The three outliers – Kelvin Benjamin, Josh Gordon, and Adam Humphries.
- Weighted Dominator Rating (DR) – first outlined by Frank DuPont in the book Game Plan, the college dominator rating represents a player’s “market share” or his percentage of his team’s offensive production. For example, a 35+% dominator indicates that a wide receiver can potentially be a team’s No. 1 wide receiver and/or a high-caliber contributor. 20-35% indicates a mid-level talent with situational upside. Less than 20% is a red flag. I calculate my own Dominator Rating at a season level, not a game level.
- College Entry Age – Also new for the 2020 model. Age is important, and you cannot accurately rate someone on a breakout age without proper context. Every once in a while, through no fault of their own, a prospect enters college at the age of 20. Meaning they never had a chance to break out at the ideal age of 18 or 19. Rather than punishing a player for this, we now adjust for it. Since 2010 (10) receivers have entered college at age 20, and (7) of them went on to have a top 24 season.
- NFL Entry Age – This is the age that each prospect is on January 1st of the year they are being drafted. I’ve learned that future elite wide receivers tend to enter before the age of 22, but the top 24 wide receivers generally enter before the age of 23.
- Prospect Success Indicator Percentile Rank: This is the percentage of how closely the prospect compares to the Top 24 wide receiver profile. The higher the rank, the close the match to the ideal profile. The percentile rank will continue to automatically refine itself as time goes on as the database grows or with the addition of any new metrics.
- Prospect Success Indicator Ceiling Rank: This is the maximum percent a prospect could have achieved if his athletic profile had been complete. For example, every year, some prospects refuse to participate in agility drills, like the 3 cone drill, or never get their hands measured; for each missing data point, I account for it in the Ceiling Score. Assuming the prospect did participate and hit the threshold to receive credit for this is the max score he could’ve achieved.
How do I use it for both Pre and Post NFL/Fantasy Rookie Draft?
- Pre-NFL Draft – view the rankings as – “Draft capital aside, who looks the most like a future Top 24 wide receiver in this rookie class?”
- Then compare their current rank to ADP to find market inefficiencies for over/undervalued players.
- Post-NFL Draft – The rankings adjust accordingly based on each prospect’s draft capital. This now accounts for the opportunity.
- Ex: Krishawn Hogan went undrafted last year; even though he has the talent to succeed, his lack of draft capital will limit the number of chances he gets to succeed in the NFL, and that means Hogan should be a late-round rookie flyer rather than a 2nd or 3rd round pick if he was drafted.
- Market Inefficiencies – Finally, I would revisit the model throughout the year to see who you should buy on discounts and who you should be selling high.
- Buy Ex: Adam Thielen – after his 1st breakout season, he was still very cheap in trades, and if you went back and saw his Pre-Draft PSI score (70th-Percentile), you would’ve tried to buy him everywhere you could before his 2017 season.
- Sell Ex: Kelvin Benjamin – after his breakout rookie season – which was driven by his 1st round draft capital and lack of other weapons on his team – you would’ve seen his Pre-draft PSI score (60th Percentile) was extremely low, and it would’ve encouraged you to sell him. Benjamin was never a top 24 wide receiver again and is now out of the league.
I’m a data analyst by trade and have begun using the skills and knowledge I have acquired over the years to help scout NFL prospects. Furthermore, I strongly believe in the use of advanced stats/metrics and models to provide an unbiased/objective lens for scouting future NFL prospects. Thanks for visiting the site and hope you enjoyed the content. View Miguel’s entire blog here.